Fund Details
| Ticker | GOLY |
| CUSIP | 86280R878 |
| Inception | 5/17/2021 |
| Exchange | CBOE |
| Total Annual Operating Expense Ratio | 0.79% |
| Distribution Frequency | Monthly |
| Investment Advisor | Rational Advisors, Inc. |
| Portfolio Manager | David Miller |
| Portfolio Manager | Charlie Ashley |
Fund Documents
Fund Description and Objective
The strategy was designed on the belief that the best way for investors to generate income that maintains its purchasing power is to combine bonds and a gold overlay within one portfolio.The Fund seeks to offer a distinct strategy that efficiently combines an investment grade bond portfolio with a gold hedge overlay in one strategy. The Fund’s investment strategy is premised on the proposition that an investment in gold can potentially provide a hedge against inflation for a bond investment.
The Fund’s investment objective is to seek investment results that correlate, before fees and expenses, to the performance of the Solactive Gold-Backed Bond Index (the “Index”).
The Index seeks to provide 100% exposure to the U.S. dollar-denominated investment grade corporate bond sector (the “Bond Component”) plus a gold inflation hedge with a notional value designed to correspond to the value of the Bond Component, with such notional value reset on a monthly basis (the “Gold Hedge Component”).
The Bond Index aims to mirror the performance of investment grade corporate bonds issued in U.S. dollars.
The Gold Hedge Index tracks the performance of the near month gold futures contracts listed on the Chicago Mercantile Exchange.
Daily NAV and Market Price
|
Ticker GOLY |
Exchange BATS |
NAV2 – |
Market Price3 – |
| . Shares Outstanding | 420000.00 | . Total Net Assets | 12398458.81 |
|---|---|---|---|
| .Median Bid/Ask Spread (30 Day)1 | – | .Premium Discount (%) | – |
GOLY Performance
| GOLY | YTD | 1M | 3M | 6M | 1 Yr | 3 Yrs | 5 Yrs | Since Inception |
| NAV | -5.18 | -5.18 | 1.64 | 20.71 | 57.44 | 28.54 | 11.88 | |
| Market Price | -3.26 | -3.26 | 3.85 | 24.18 | 57.99 | 28.74 | 11.96 |
The performance data quoted above represents past performance. Past performance is not a guarantee of future results. Investment return and value of the ETF shares will fluctuate so that an investor’s shares, when sold or redeemed, may be worth more or less than their original cost. Current performance may be lower or higher than performance data quoted. Shares are bought and sold at market price (not NAV) and are not individually redeemed from the ETF. Total Returns are calculated using the daily 4:00pm net asset value (NAV). Market returns are based on the composite closing price and do not represent the returns you would receive if you traded the shares at other times. The first trading date is typically several days after the fund inception date. Therefore, NAV is used to calculate market returns prior to the first trade date.
| HoldingName | Ticker | MarketValue% | MarketValue | SharesQuantity | NotionalValue% | NotionalValue |
|---|---|---|---|---|---|---|
| CASH AND CASH EQUIVALENTS | 1.86365727% | 3473029.53 | 3473029.53 | 1.863657% | 3473029.53 | |
| ABBVIE IN 3.2% 11/21/29 | 2.35870149% | 4395572.10 | 4510000.0000 | 2.358701% | 4395572.10 | |
| AMAZON.CO 1.5% 06/03/30 | 2.38653908% | 4447449.01 | 4920000.0000 | 2.386539% | 4447449.01 | |
| AMGEN INC 2.2% 02/21/27 | 1.73193957% | 3227566.22 | 3280000.0000 | 1.731940% | 3227566.22 | |
| ANHEUSER- 4.7% 02/01/36 | 2.86406775% | 5337350.39 | 5330000.0000 | 2.864068% | 5337350.39 | |
| APPLE INC 3.35% 02/09/27 | 1.97471871% | 3679998.73 | 3690000.0000 | 1.974719% | 3679998.73 | |
| BAT CAPIT 3.557% 08/15/27 | 2.18807414% | 4077598.50 | 4100000.0000 | 2.188074% | 4077598.50 | |
| BOEING CO 5.15% 05/01/30 | 2.50188852% | 4662409.14 | 4510000.0000 | 2.501889% | 4662409.14 | |
| BROADCOM 5.2% 07/15/35 | 2.04845989% | 3817419.54 | 3690000.0000 | 2.048460% | 3817419.54 | |
| CAPITAL O 3.8% 01/31/28 | 0.87679741% | 1633961.00 | 1640000.0000 | 0.876797% | 1633961.00 | |
| CHEVRON C 2.236% 05/11/30 | 2.05345596% | 3826730.00 | 4100000.0000 | 2.053456% | 3826730.00 | |
| CITIGROUP VRN 03/31/31 | 2.87429738% | 5356413.88 | 5330000.0000 | 2.874297% | 5356413.88 | |
| COCA-COLA 1.375% 03/15/31 | 2.13640664% | 3981313.22 | 4510000.0000 | 2.136407% | 3981313.22 | |
| COSTCO WH 1.6% 04/20/30 | 1.80748172% | 3368343.25 | 3690000.0000 | 1.807482% | 3368343.25 | |
| CVS HEALT 4.3% 03/25/28 | 2.21023031% | 4118887.76 | 4100000.0000 | 2.210230% | 4118887.76 | |
| DOW CHEMI 3.6% 11/15/50 | 1.16046666% | 2162594.50 | 3280000.0000 | 1.160467% | 2162594.50 | |
| EQUINIX I 3.2% 11/18/29 | 2.75950158% | 5142485.48 | 5330000.0000 | 2.759502% | 5142485.48 | |
| FISERV IN 3.5% 07/01/29 | 1.92729329% | 3591618.81 | 3690000.0000 | 1.927293% | 3591618.81 | |
| GENERAL E 5.875% 01/14/38 | 1.68151925% | 3133605.14 | 2870000.0000 | 1.681519% | 3133605.14 | |
| GOLDMAN S VRN 01/27/32 | 2.35765309% | 4393618.35 | 4920000.0000 | 2.357653% | 4393618.35 | |
| HOME DEPO 5.875% 12/16/36 | 2.16168282% | 4028416.80 | 3690000.0000 | 2.161683% | 4028416.80 | |
| JPMORGAN VRN 03/24/31 | 2.67140070% | 4978304.56 | 4920000.0000 | 2.671401% | 4978304.56 | |
| METLIFE I 4.55% 03/23/30 | 2.25150922% | 4195813.31 | 4100000.0000 | 2.251509% | 4195813.31 | |
| MPLX LP 2.65% 08/15/30 | 1.64397231% | 3063634.31 | 3280000.0000 | 1.643972% | 3063634.31 | |
| NEXTERA E 2.25% 06/01/30 | 2.23816850% | 4170952.14 | 4510000.0000 | 2.238169% | 4170952.14 | |
| NORTHERN 1.95% 05/01/30 | 0.81044071% | 1510301.57 | 1640000.0000 | 0.810441% | 1510301.57 | |
| ORACLE CO 5.375% 07/15/40 | 2.02963582% | 3782339.83 | 4100000.0000 | 2.029636% | 3782339.83 | |
| PACIFIC G 4.55% 07/01/30 | 1.99099482% | 3710330.17 | 3690000.0000 | 1.990995% | 3710330.17 | |
| SHERWIN-W 2.95% 08/15/29 | 1.06030135% | 1975930.84 | 2050000.0000 | 1.060301% | 1975930.84 | |
| SOUTHWEST 5.125% 06/15/27 | 1.78064078% | 3318323.65 | 3280000.0000 | 1.780641% | 3318323.65 | |
| VERIZON C 4.522% 09/15/48 | 2.79836197% | 5214904.00 | 6150000.0000 | 2.798362% | 5214904.00 | |
| WALT DISN 2.65% 01/13/31 | 2.69798087% | 5027838.20 | 5330000.0000 | 2.697981% | 5027838.20 | |
| WELLS FAR 3.% 10/23/26 | 2.84445449% | 5300799.97 | 5330000.0000 | 2.844454% | 5300799.97 | |
| SSGH FUND LTD CFC | 16.17916837% | 30150784.85 | 4474.0000 | 16.179168% | 30150784.85 | |
| US T-NOTE 3.375% 12/31/27 | 10.71037090% | 19959375.00 | 20000000.0000 | 10.710371% | 19959375.00 | |
| ORANGE SA 9.% 03/01/31 | 2.38495910% | 4444504.63 | 3690000.0000 | 2.384959% | 4444504.63 | |
| SHELL INT 6.375% 12/15/38 | 1.98280757% | 3695072.77 | 3276000.0000 | 1.982808% | 3695072.77 | |
| CASH AND CASH EQUIVALENTS | 4.83921610% | 1459061.63 | 1459061.63 | 4.839216% | 1459061.63 | |
| PAYB GOLY TRS BCKTGOL3 EQ | -530.03327338% | -159809191.36 | -159809191.3654 | -530.033273% | -159809191.36 | |
| RECV GOLY TRS BCKTGOL3 EQ | 620.23096918% | 187004504.47 | 32144.3595 | 620.230969% | 187004504.47 | |
| US T-BILL DN 3/19/2026 | 4.96308810% | 1496410.01 | 1500000.0000 | 4.963088% | 1496410.01 |
On March 23rd, Neel Kashkari the president of the Federal Reserve Bank of Minneapolis said “there’s an infinite amount of cash in the Federal Reserve and they will do anything they need to make sure there’s enough cash in the banking system.”
The Federal Reserve has increased the money supply by over 30% since 2020 and it continues to do another $120 Billion of quantitative easing each month. However, the Federal Reserve can’t print gold.
Source: FRED, July 2021

Inflation Can Potentially Sabotage the Purchasing Power of Your Investments.

*Inflation—the rise in the price of goods and services—reduces the purchasing power each unit of currency can buy.
*Rising inflation has an insidious effect: input prices are higher, consumers can purchase fewer goods, revenues and profits decline, and the economy slows for a time until a measure of economic equilibrium is reached.


Did you know that inflation can potentially derail your investment goals if you don’t hedge against it??
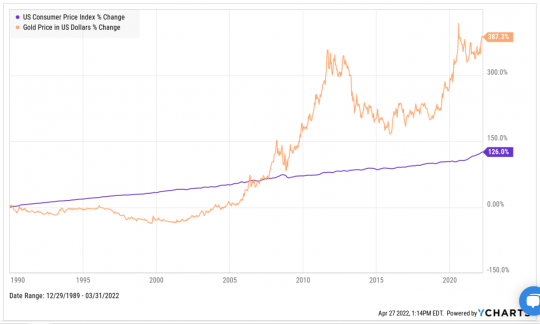
- Gold has historically kept pace with inflation while the dollar historically lost purchasing power each year.3
- Alternative gold ETFs track the price of gold but do not pay a monthly distribution
- Gold can potentially serve a key role in a portfolio similar to a sound “hard currency”

Media Coverage


